Charts
Charts that read themselves.
Live charts from your broker, with Heimdall drawing what a seasoned chartist would. Press once for a stop loss and take profit that fit how the market is moving, then drag either one and see what it costs.
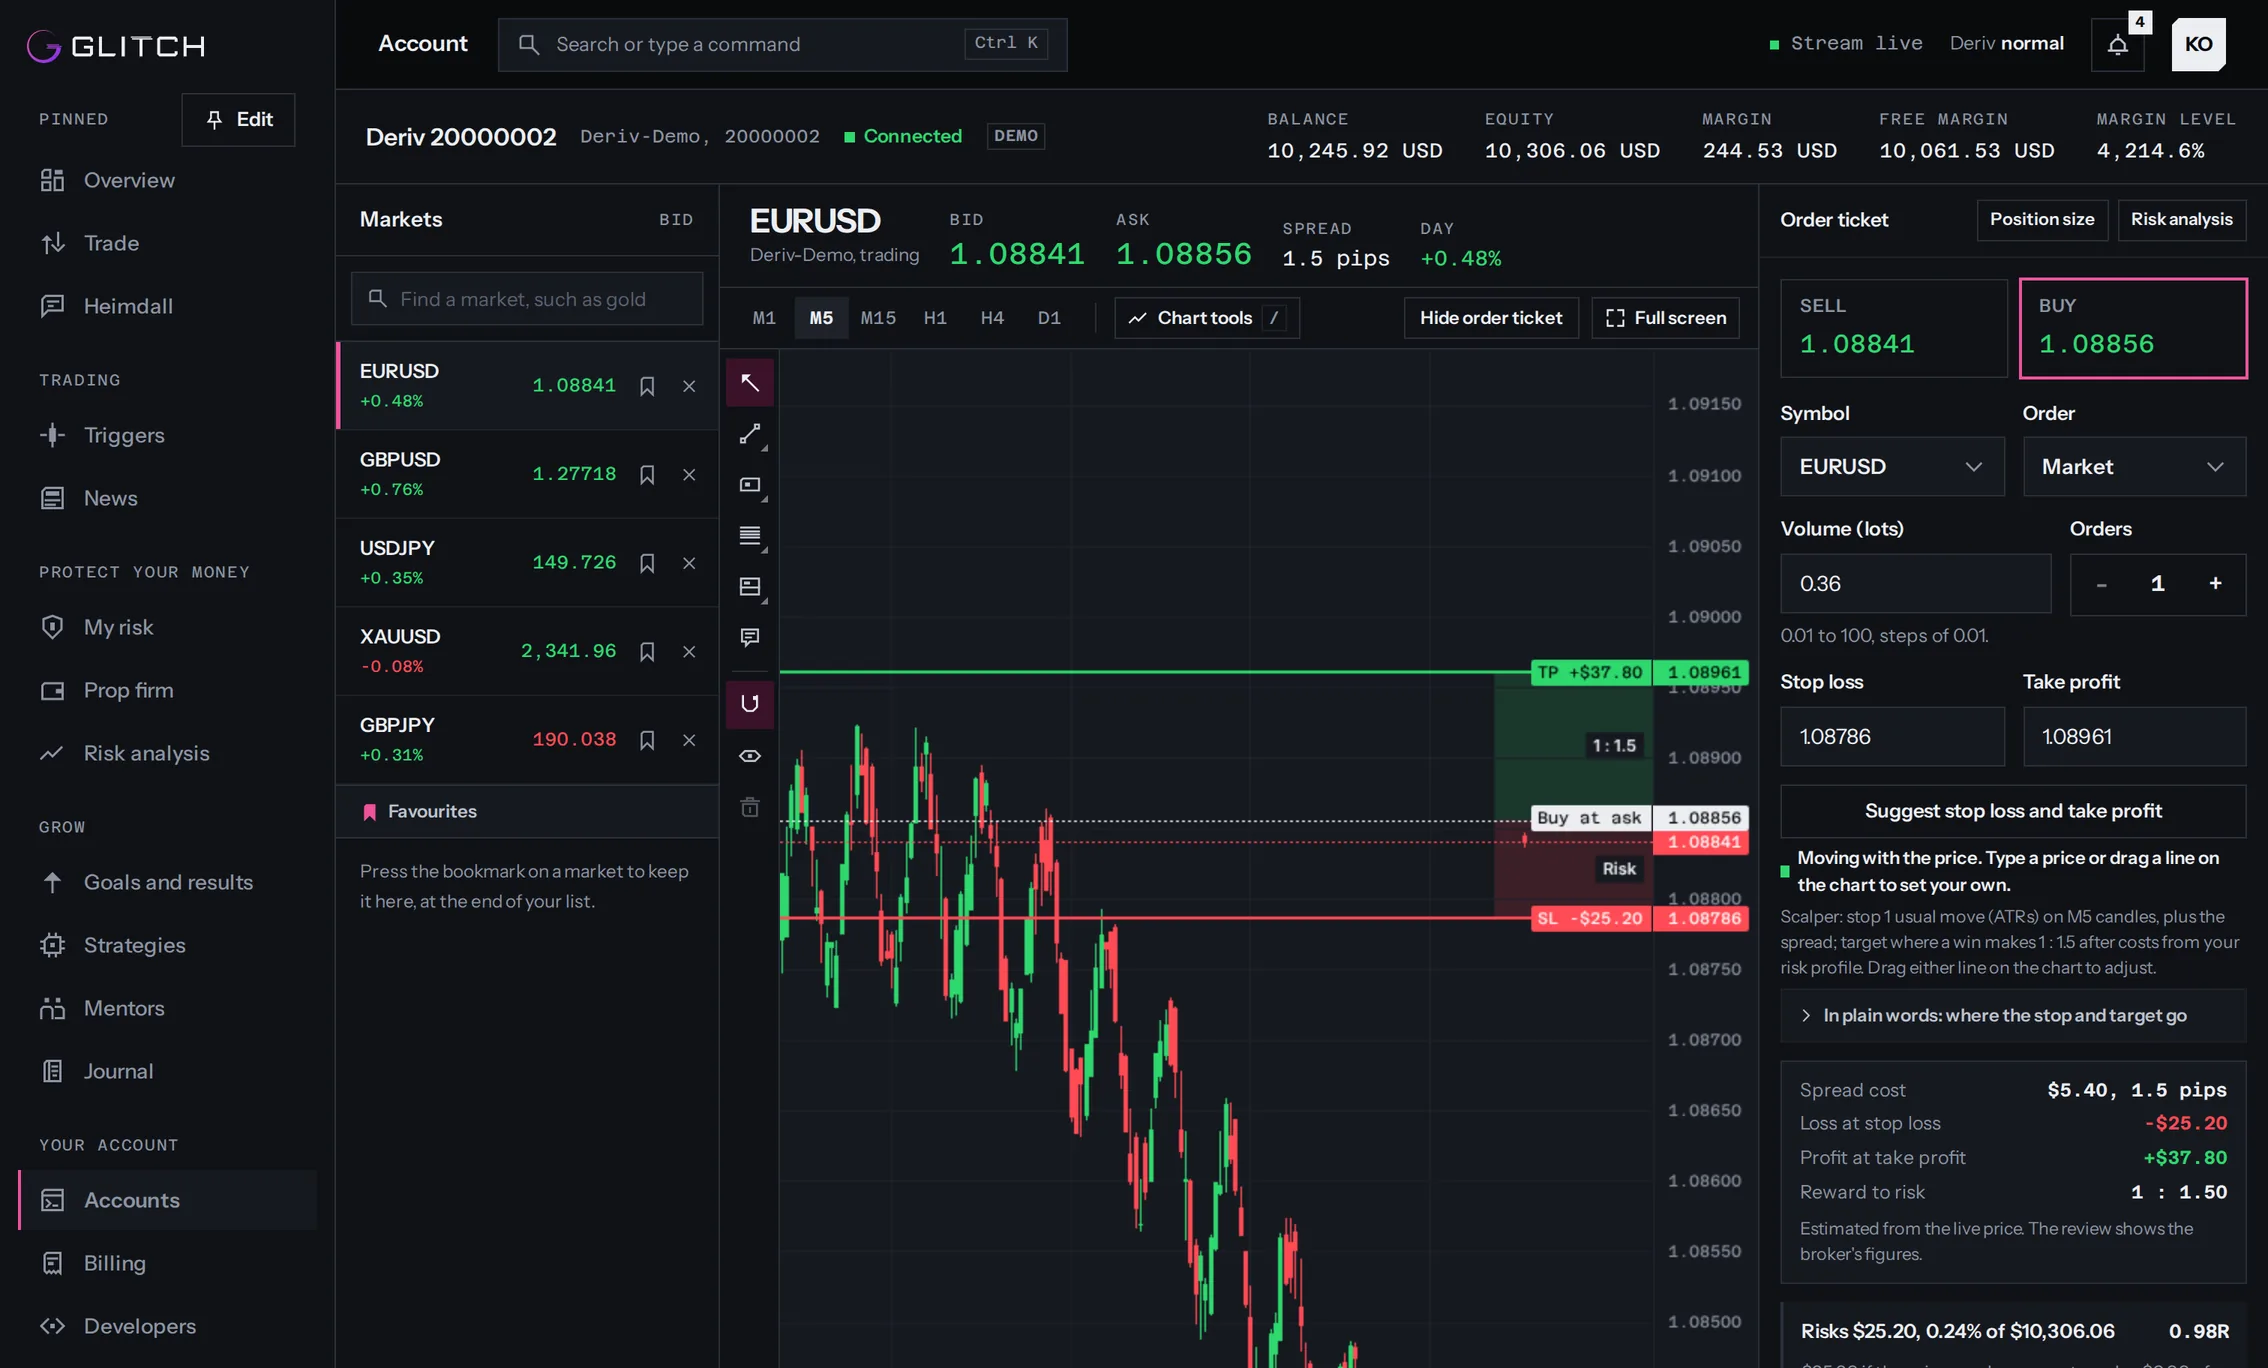
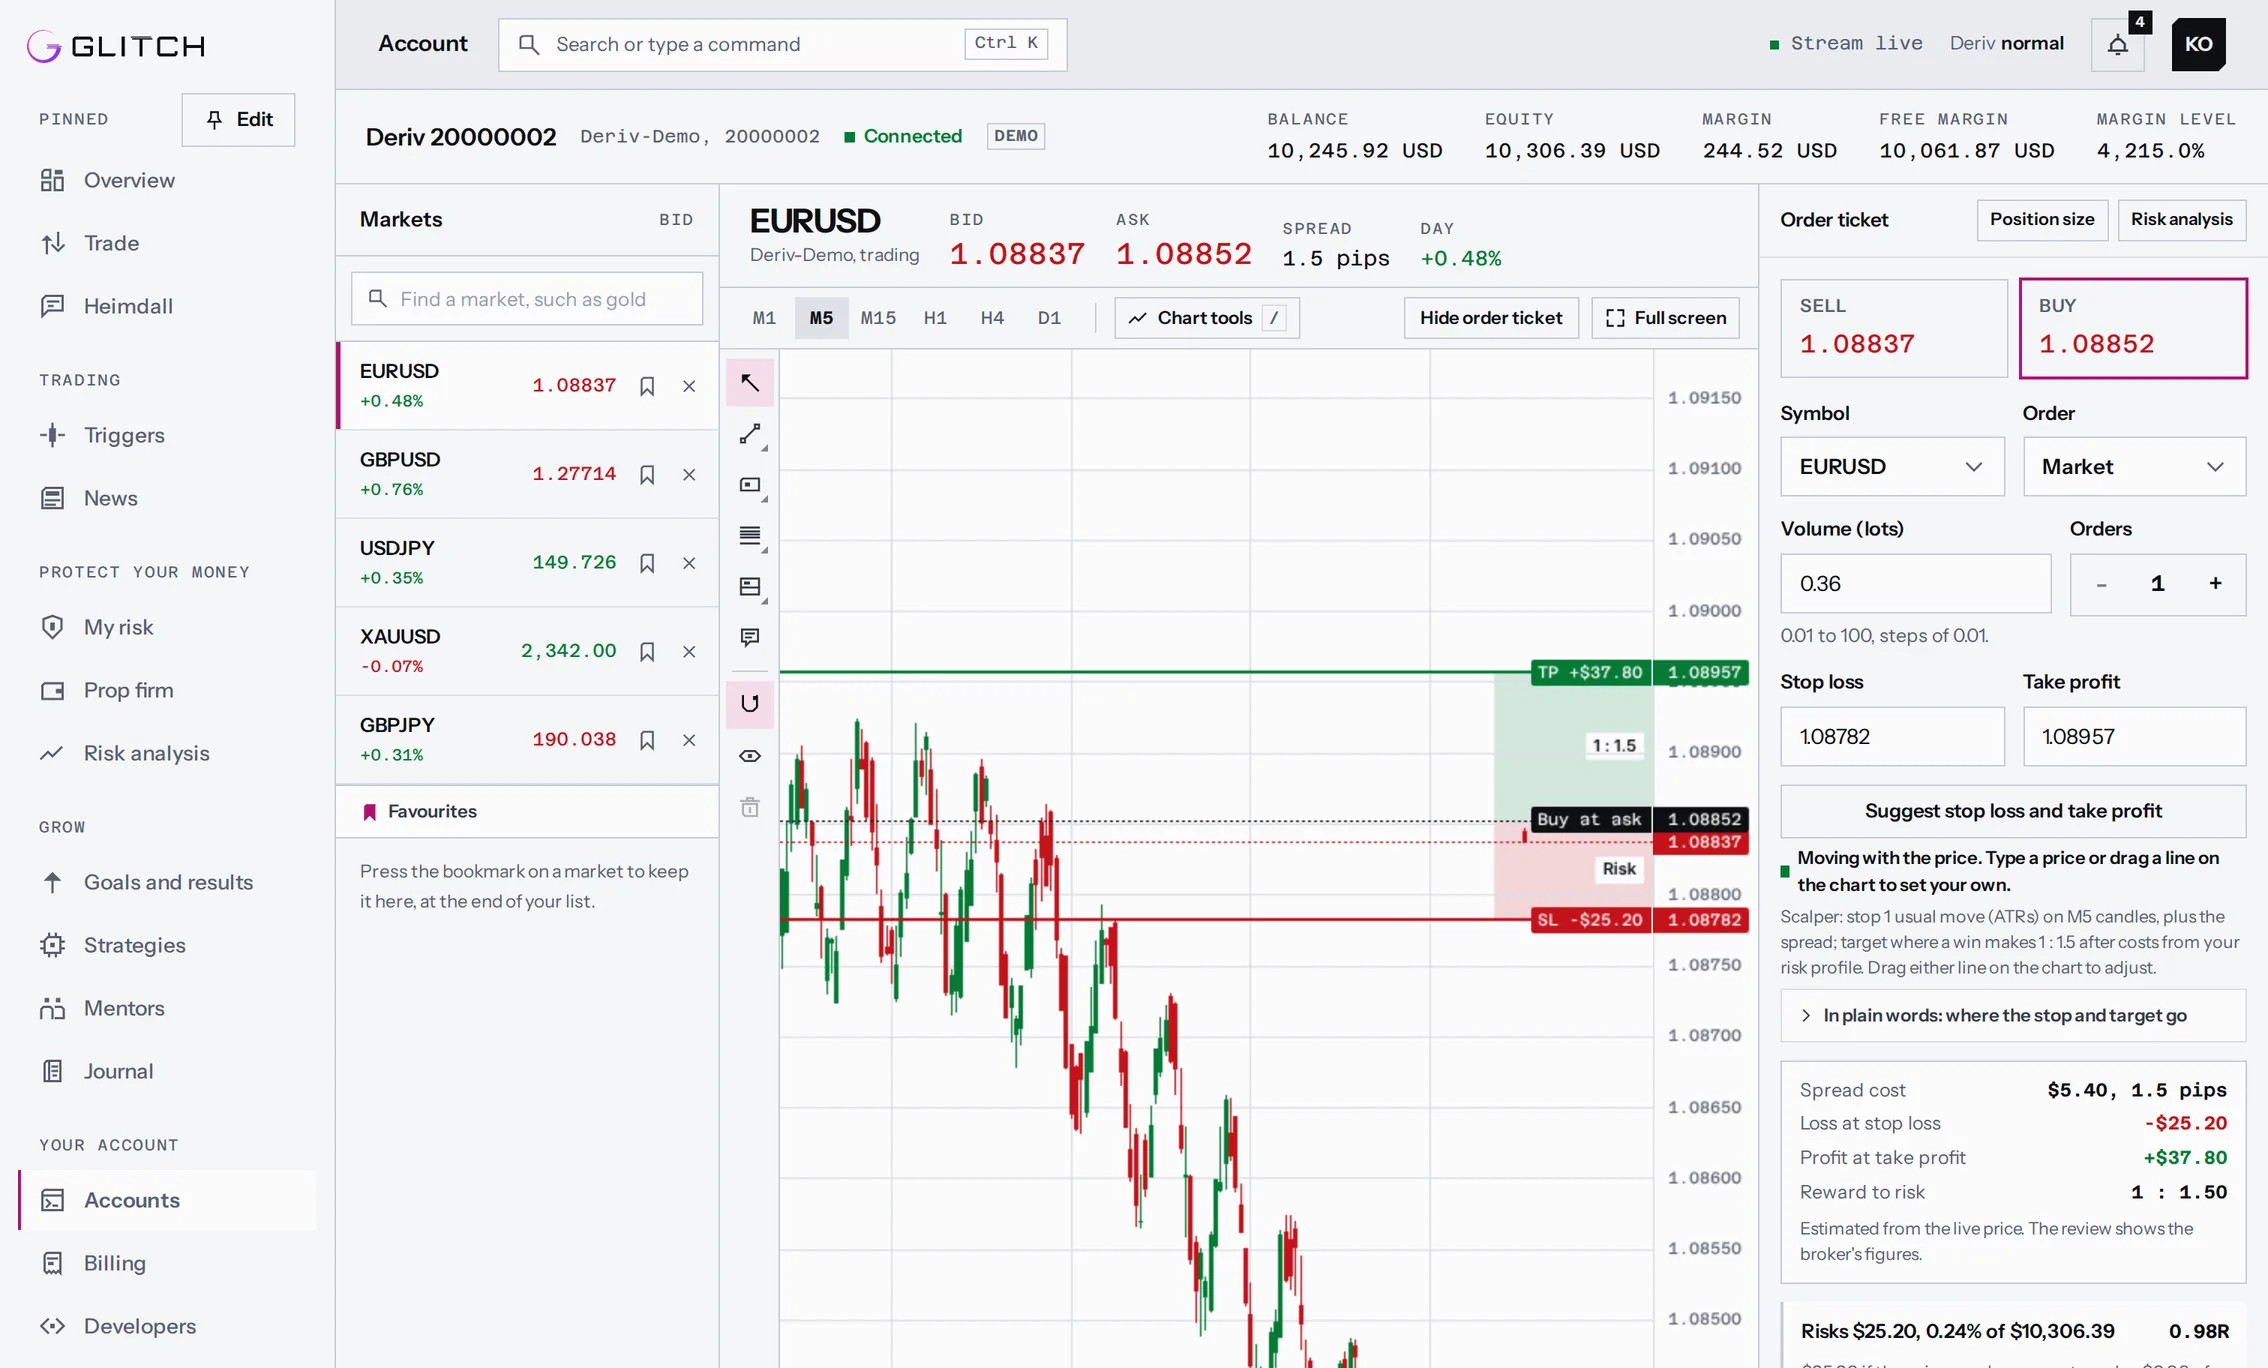
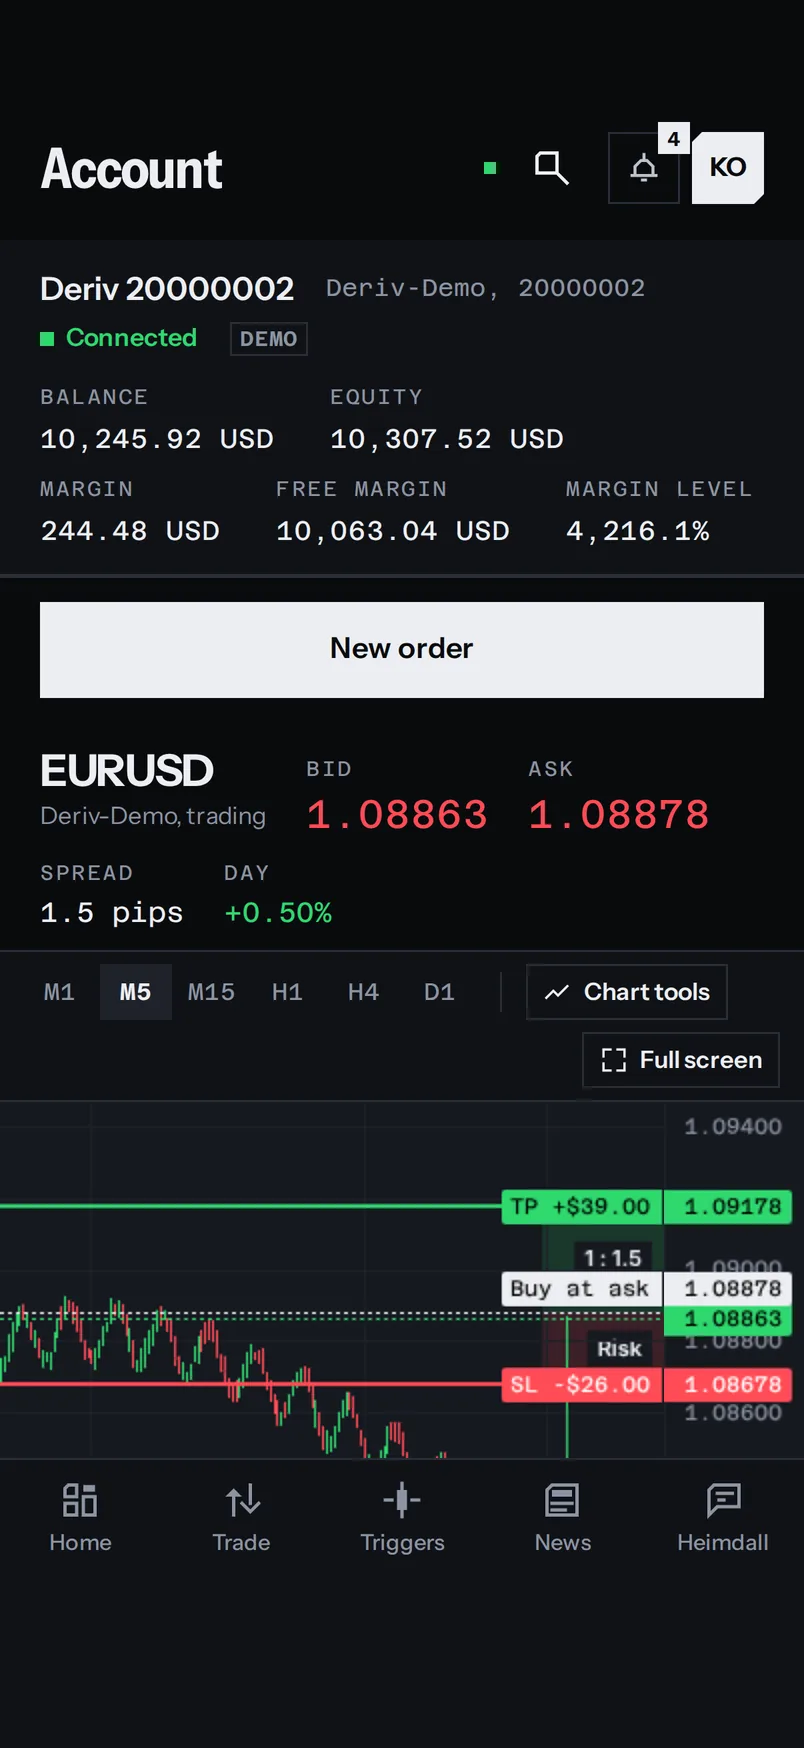
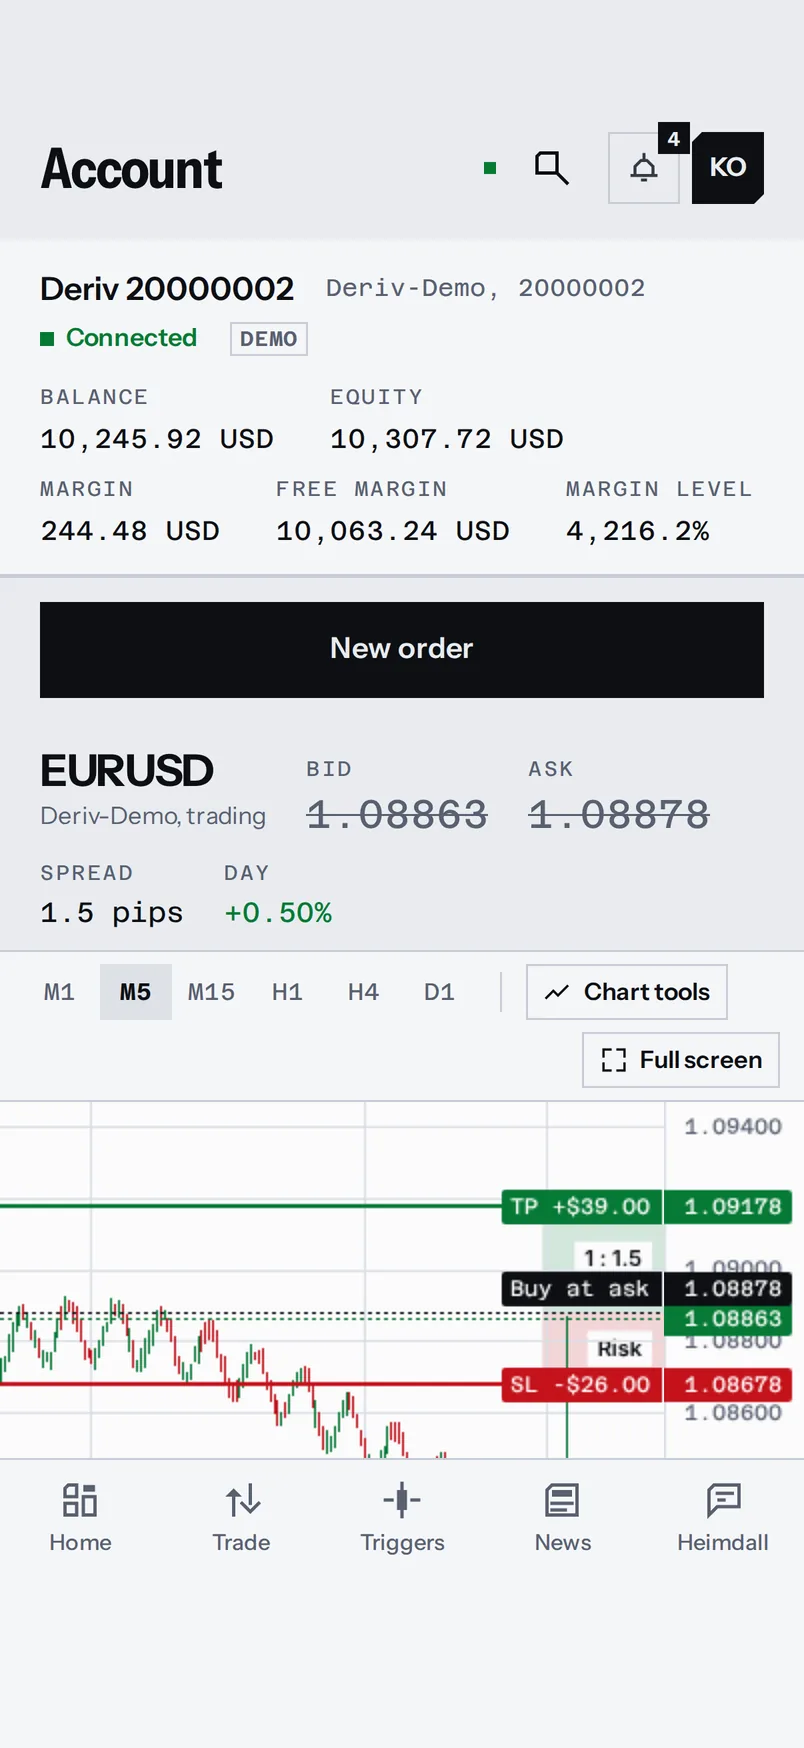
Press once and Glitch suggests a stop loss and a take profit that fit how the market moves, with what each would cost or pay.
Auto charting
Ask for a chart. Get an analyst.
Heimdall reads the candles and draws what a seasoned chartist would: the prices the market keeps turning at, the shape of the trend, and how much strength is left in the move. Switch each layer on to see it drawn.
Prices where buyers or sellers stepped in again and again. The more touches, the stronger the level.
Higher highs and higher lows mean an uptrend. Lower ones mean a downtrend. Glitch marks each one.
The line the lows have been rising along. A close below it says the trend may be over.
RSI, the relative strength index, from 0 to 100. Above 70 the move may be tired. Below 30, oversold.
The details.
Support and resistance
Prices the market keeps turning at, with how many times each was touched.
Turning points
Highs and lows marked, so the trend is plain to see.
Indicators, set the MetaTrader way
Moving averages, RSI, Stochastic and more, with the settings you already know.
A stop and target, suggested
One press places a stop loss and a take profit that fit how far the market usually moves, costs counted.
Lines you can drag
Move your stop or target on the chart and see the money at risk change.
Every timeframe
From one minute to one month, on every symbol your broker lists.
The future of trading is not coming. It is already in your pocket.
Discover your next infinite money Glitch.